|
|
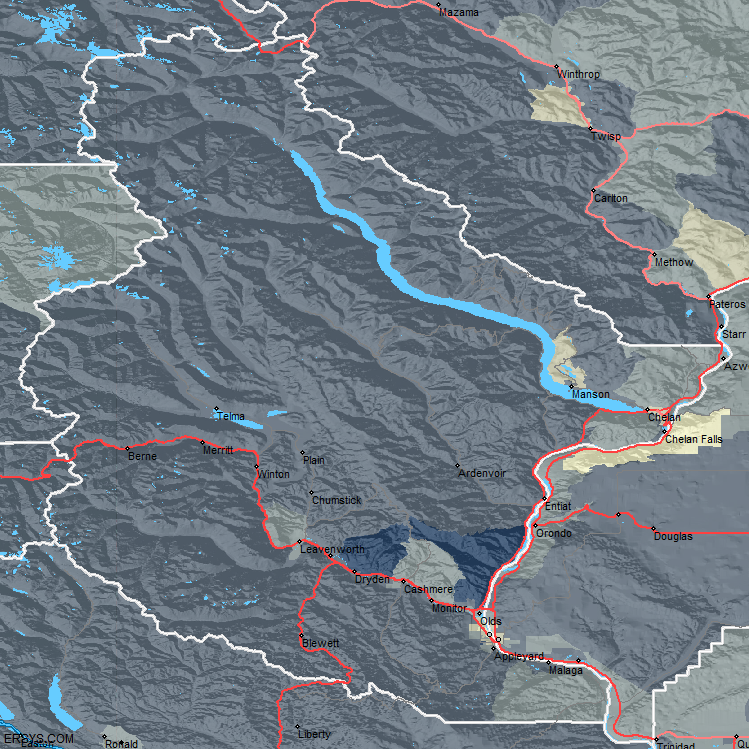
Chelan County |
Per Cent Home Owners | |||||
|
|
||||||
| Over 90% | 70 to 90 | 50 to 70 | 30 to 50 | Under 30% | ||
| ||||||


Overview
The map on the left shows the percentage of home owners in Chelan County. For most households it is the single largest investment that a household can make. Owning a home means ...
- • Building generational wealth
- • Liberation from rental increases
- • Safeguards against inflation
- • Potential tax savings
- • Social, health, and psychological benefits
Base on various studies, neighborhoods with high percentages of owned homes tend to be more stable over time. Thereby creating a better environment for raising children, creating long term relationships and development of a stronger neighborhood (e.g. crime prevention and civic pride)
Sources: STI: PopStats, Circa April 2025
Owner/Renter Comparison

| Data Topic | Chelan County | Washington | Nation |
| Total Population | 81,900 | 8,038,201 | 343,250,809 |
Housing | |||
| Owner Occupied | 20,076 | 1,970,729 | 84,857,403 |
| Renter Occupied | 11,346 | 1,142,258 | 46,440,947 |
| Vacant | 7,197 | 231,084 | 13,786,062 |
| Total Housing | 38,619 | 3,344,071 | 145,084,412 |
Per Cent Housing | |||
| Owner Occupied | 51.98 | 58.93 | 58.49 |
| Renter Occupied | 29.38 | 34.16 | 32.01 |
| Vacant | 18.64 | 6.91 | 9.50 |


